Senior Design Project | Summary of Program Metrics
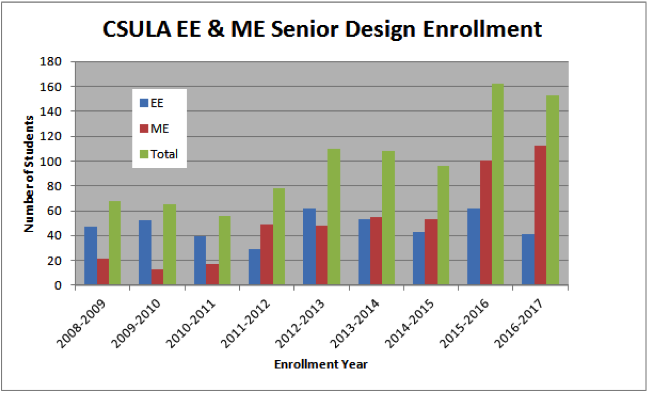
Electrical Engineering (EE) and Mechanical Engineering (ME) metrics presented below.
Civil Engineering (CE) and Computer Science (CS), and Technology (TECH) TBA
Last year (2015-16):
• 163 Students - 63 EE, 100 ME
• 35 Project teams, 19 Industry sponsored
• 6 Competition projects
• 2 Charity projects, 5 Faculty research projects
• Projects spanned six career sectors:
- Automotive - Aerospace
- Power and Energy - Biomedical
- Robotics & Controls - Agriculture
This year (2016-17):
• ~153 Students - 41 EE, 112 ME
• 33 Project teams, 14 Industry sponsored
• 3 Competition projects
• 7 Charity projects
• 8 Faculty research projects
• 2 projects to help the college
Learning Metrics 2015 - 2016
• Oral presentations per student: ~6
• Written reports per student: 17
• Average attendance for all course lectures: 92.4%
• Projects with simulation/modeling content: 61%
• Total projects that applied 3D printing: 60%
• Projects that validated their design by test: 86%
• Number of field site visits by student teams: 44
Tutorial Workshops Taught by Students
| WORKSHOPS | TITLES |
| 5 | LabVIEW |
| 4 | NASTRAN |
| 2 |
MATLAB |
| 1 | Simulink |
| 3 | SolidWorks |
| 1 | AutoCAD |
| 1 | ANSYS CFD |
| 3 | Arduino Programing |
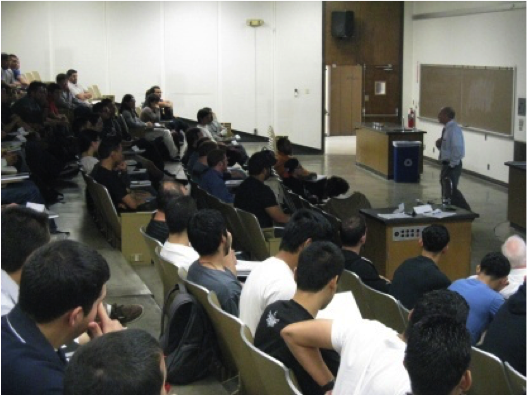
LECTURES
Expert presentations with practical design examples and applications.
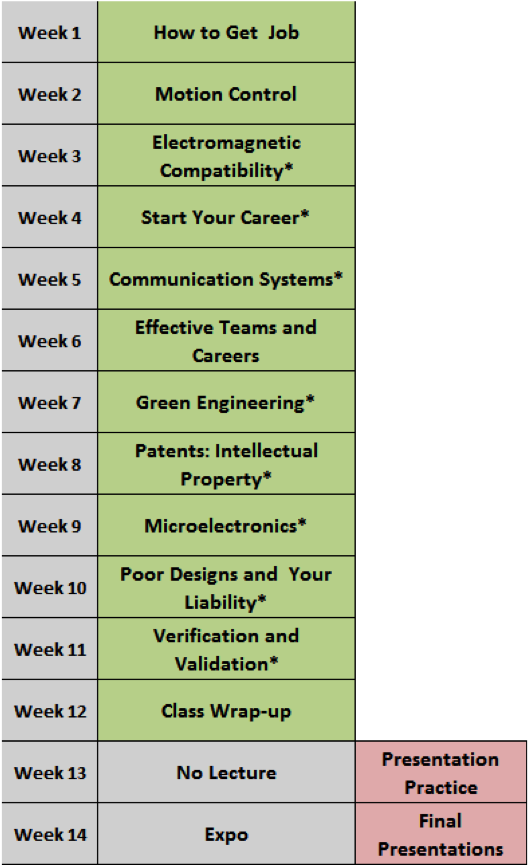
Fall Lecture Plan
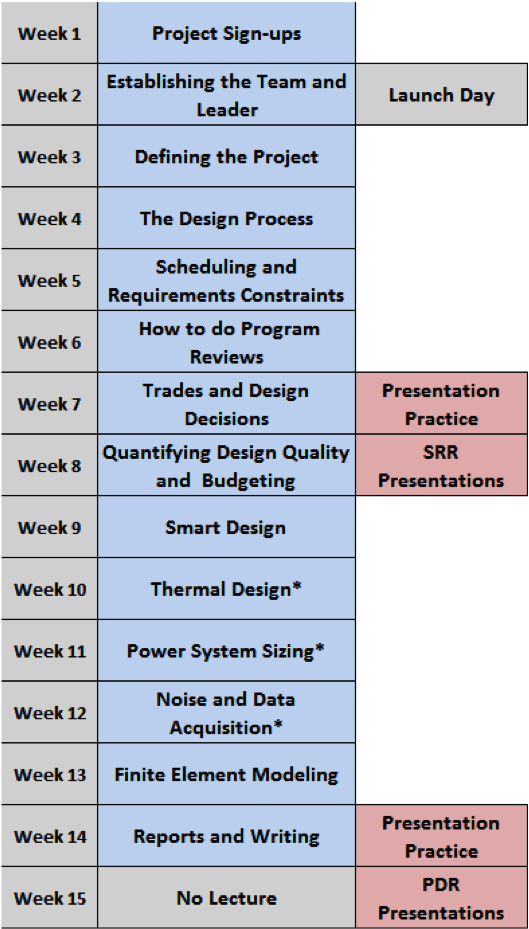
*Industry guest expert lecturer