Updated on 7/1/26
Welcome to the Enrollment Management Dashboards of the Office of Institutional Effectiveness, designed for internal university use. To access these dashboards, please ensure that you are logged into your Cal State LA account and connected to the university's VPN. For assistance with connecting to the VPN, kindly refer to this article link.
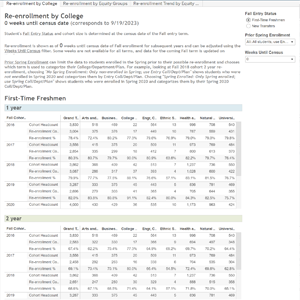
Re-Enrollment Dashboard (Fall 2026)
This interactive Re-Enrollment Dashboard provides a comprehensive overview of retention metrics for fall cohort students, including both first-time freshmen (FTF) and transfer entrants. It showcases the headcount of the initial cohort alongside successive retention counts after one, two, and three years, effectively presenting the 1-, 2-, and 3-year retention rates. Designed to assist in monitoring student persistence and identifying retention trends, the dashboard updates regularly every Monday with preliminary ERSS starting ~10-12 weeks from the Fall census date.
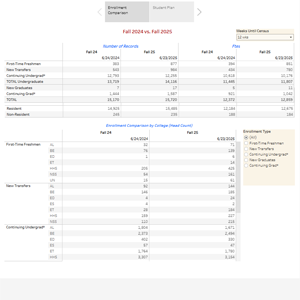
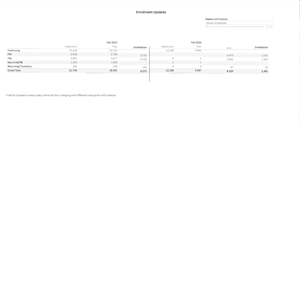
Enrollment Comparison: Fall 2026
This interactive Enrollment Update dashboard allows you to compare Spring-to-Spring enrollment. Options include distance from the Census date, enrollment type (e.g., First-Time Freshmen), and by colleges.
This interactive Enrollment Comparison dashboard allows you to compare Fall-to-Fall enrollment. Options include type of student (continuing, FTF, TR, New graduates/Postbac, and Returning/Transitiory students).
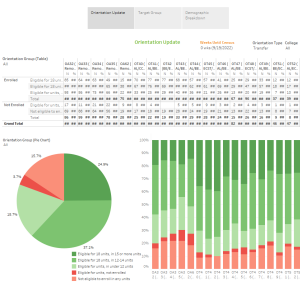
Orientation Dashboard (Fall 2026)
A weekly tool to track enrolled versus non-enrolled students, segmented by college and orientation group. It aids in identifying and reaching out to potential students who are eligible but not yet enrolled, based on enrollment eligibility. Refresh begins with the start of new student orientation and fall enrollment.
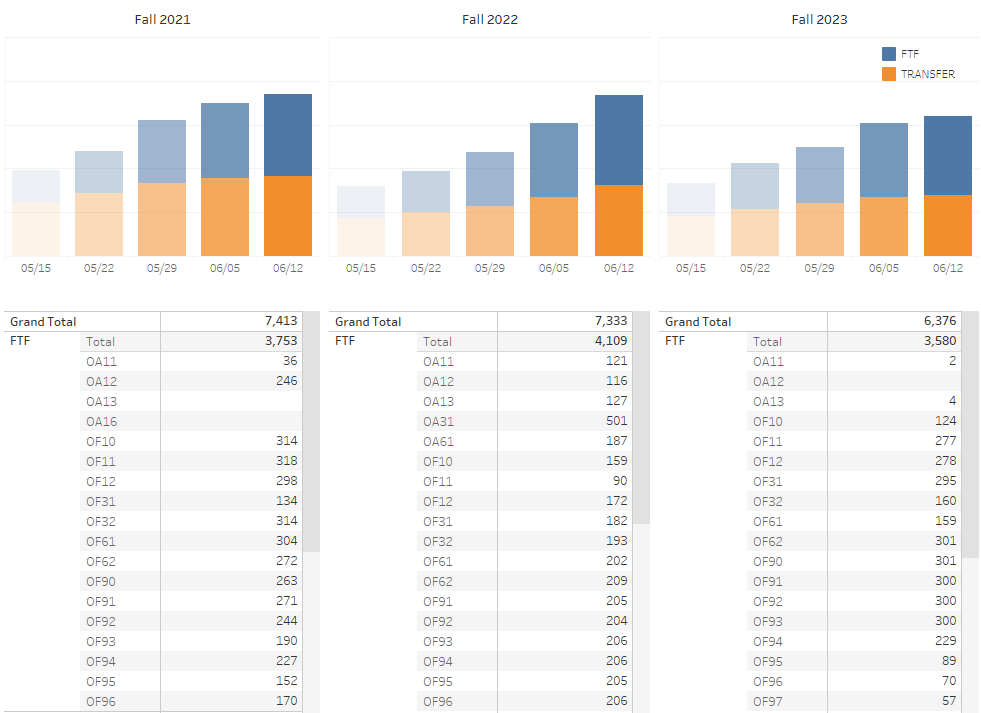
Orientation Comparison Dashboard (Fall 2026)
This dashboard allows users to compare the current fall and previous fall orientation sign-ups for FTF and TR students, useful for projecting new student enrollment. The refresh process commences once prospective students register for new student orientation.
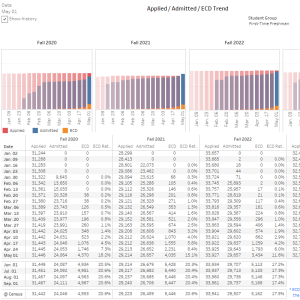
ECD Trend Dashboard (Fall 2026)
A dynamic tool for tracking and comparing ECD rates over the past four years, segmented by race/ethnicity, to project new student enrollment. The refresh cycle begins once prospective students make their early decision commitments.
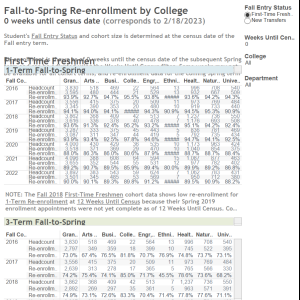
Fall-to-Spring Re-Enrollment Dashboard (Spring 2026)
This interactive Re-Enrollment Dashboard provides a comprehensive overview of retention metrics for fall cohort students, including both first-time freshmen (FTF) and transfer entrants. It showcases the headcount of the initial cohort alongside successive retention counts for 1-term, 3-term, and 5-term retention rates (Fall-to-Spring retention). Designed to assist in monitoring student persistence and identifying retention trends, the dashboard updates regularly every Monday with preliminary ERSS starting ~10-12 weeks from the Fall census date.
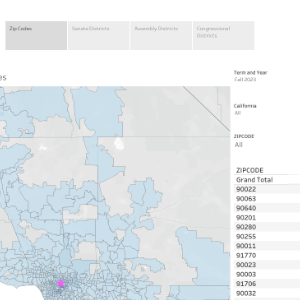
District and Zipcode Dashboard
The provided dashboard presents a comprehensive overview of the enrollment and graduation by Zip codes, Senate, Assembly, and Congressional Districts.
The dashboard will be updated yearly after the fall census (Nov).
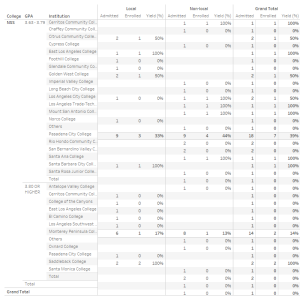
Yield Analysis for FTF and Transfers
The provided dashboard presents a comprehensive analysis of the enrollment yield rates of admitted students for First-Time Freshmen (FTF) and Transfers (TR). The analysis is categorized based on local/non-local status with college, plan, GPA range, and previous institution.
The dashboard will be updated 6 weeks after the fall census (Nov) and spring census (April) to help with admission planning.
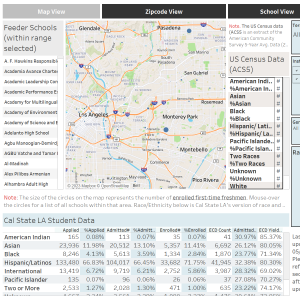
Feeder Schools Admission Data by Distance Dashboard
This dashboard presents an analysis of feeder school data, detailing applied, admitted, and enrolled students, segregated by ethnicity and distance. It integrates data from the US Census and California Department of Education regarding public school demographics. It refreshes eight weeks following each semester's census.
If you need further assistance, please do not hesitate to contact the IE Office.