DER Dashboard: A dashboard with section level enrollment/FTES data including combined sections, primary departments, new students, advanced filtering, and course level subtotals.
Daily Enrollment Report: Excel files with course-level data on enrollment and FTES.
Daily Major files: Student-level data of Major and class level.
More Daily Enrollment dashboard information can be found below or by clicking on this link, More Information Section.
Each term report is frozen once census date is reached. For more reports from previous terms, please go to the Resources page.
The dashboard shows enrollment data, updated on a weekly basis, during the enrollment cycle for a given term. Included is information about headcount, FTES, and the number of students who have enrolled in different academic plans and sub-plans. For assistance on accessing the information on the dashboard, please contact [email protected].
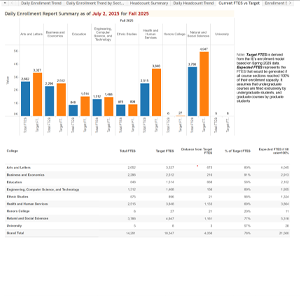
The Daily Enrollment Report (DER) dashboard displays actual Full-Time Equivalent Students (FTES) for each college alongside the target FTES derived from our most recent enrollment projection model. Users can view the college of interest in both graph and table format, providing a clear day-by-day view of where enrollment stands relative to goals. Action: Use this to monitor how close your college is to meeting enrollment targets and identify early whether additional outreach or course adjustments are needed.
FTES, Seats occupied compared with last year
This enrollment dashboard offers a side-by-side comparison of current term course enrollments versus the same time point last year, broken out by course format (CS number) and by college. It allows selection of the term (for example, Fall) and the enrollment metric (undergraduate FTES, graduate FTES, total headcount, waitlist headcount, non-resident FTES, or resident FTES) so you can quickly see how this term’s demand measures up to previous year's patterns. Action: Identify shifts in student demand or scheduling needs by comparing patterns across terms and course types and adjust course offerings or outreach accordingly.
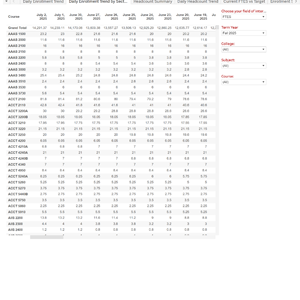
Daily Enrollment by course and dates
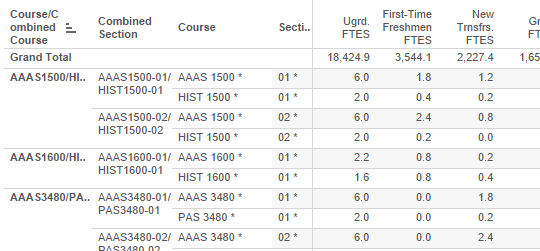
This view provides a granular, day-by-day timeline of enrollment trends at the individual course section level, showing FTES, waitlist counts, and total headcounts over time. You can filter by college, subject, and course number, choose which enrollment outcome to display (FTES, waitlist, or total headcount), and narrow the results to a specific date range on the table, making it easy to track how each course fills up throughout the enrollment period. Action: Pinpoint under-enrolled or over-capacity sections early in the registration period and collaborate with department chairs to adjust offerings or manage waitlists.
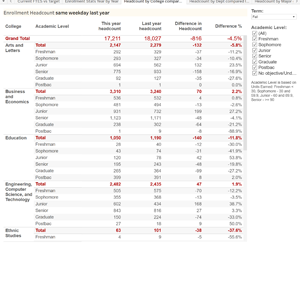
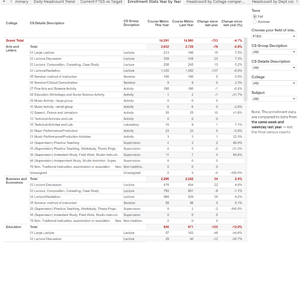
Headcount compared with last year (table by college)
This view provides a granular, day-by-day timeline of enrollment trends at the individual course section level, showing FTES, waitlist counts, and total headcounts over time. You can filter by college, subject, and course number, choose which enrollment outcome to display (FTES, waitlist, or total headcount), and narrow the results to a specific date range on the table, making it easy to track how each course fills up throughout the enrollment period. Action: Pinpoint under-enrolled or over-capacity sections early in the registration period and collaborate with department chairs to adjust offerings or manage waitlists.
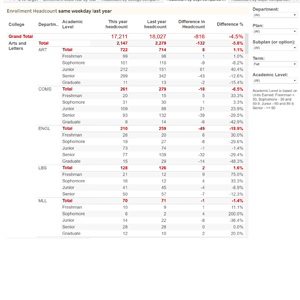
Headcount compared with last year (table by dept)
Similar to the college-level view but focused on departments, this daily table compares today’s headcount against the same date last year for each department. Filters include term selection (Fall or Summer), specific department, and minor (subplan), giving you a detailed snapshot of where departmental demand is accelerating or decelerating relative to last year. Action: Use this to spot enrollment trends at the department level and consider reallocating recruitment or advising efforts accordingly